Sunday, October 27, 2024

Prices in Block E, Phase 8, Bahria Town, Rawalpindi/Islamabad, Pakistan


(Source: https://bahriatown.com/)

Bahria Town, Phase 8, has Block E containing different parts, including E1, E2, and E3. E block has mostly the sizes of plots in the range of 10 marlas, though some plots are also available in the size of 1 kanal. The middle ring road side of this area is not only heighted but also has higher prices, such as in the range of 1.25 crores, while the other side from middle ring road has plots in the size range of 90 lacs. During the last 1.5 to 2 years, prices have gone down about 20 lac rupees. Nevertheless, all E1, E2, and E3 areas are possessionable. In the E1, the prices are in the range of 90 lacs to 1 crore. E1 is also a heighted area. In E1, some plots of 6 marlas are also available, the prices of which are in the range of 75 lacs. E2 and E3 have 5 marla plots. In E3, 5 marla plots are available in the price range of 60 lacs.

Source:

Bahria Town Rawalpindi Phase 8 E Block | Price Latest Updates | Advice Associates - Advice Associates - https://www.youtube.com/watch?v=y7f0xpBmp6c


Day 12: A challenge to learn basics of Structural Equation Modeling (SEM) using lavaan and semPlot packages in R


During the next 12 days, I will learn and repeat the basics of structural equation modeling (SEM) using lavaan and semPlot packages in R.

You can search my lavaan posts by typing: #UsmanZafarParacha_lavaan , and semPlot posts by typing: #UsmanZafarParacha_semPlot

=============

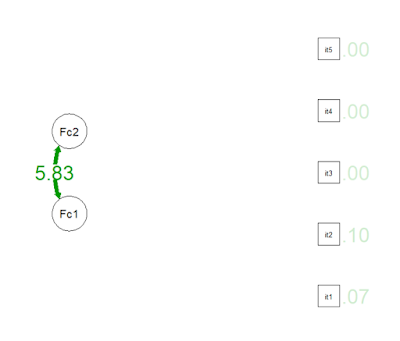
During this day, I learned and studied about Confirmatory Factor Analysis (CFA) while implementing a polychoric matrix and use the robust diagonally weighted least squares (RDWLS) method to evaluate the model fit using several fit indices such as RMSEA, CFI, TLI, SRMR, and chi-square/DF. This same thing can also be found in one of the research papers, such as that conducted Almeida et al. (2024).

Initially, I loaded the essential libraries and created supposed data using the following lines of codes:


library(lavaan)

library(semPlot)

library(psych)


set.seed(123)  # For reproducibility

n <- 200  # Number of participants


# Simulate ordinal data (Likert scale: 1 to 5)

item1 <- sample(1:5, n, replace = TRUE)

item2 <- sample(1:5, n, replace = TRUE)

item3 <- sample(1:5, n, replace = TRUE)

item4 <- sample(1:5, n, replace = TRUE)

item5 <- sample(1:5, n, replace = TRUE)


# Create a data frame

data <- data.frame(item1, item2, item3, item4, item5)


Then, using the psych package, the polychoric correlation matrix was determined:


polychoric_matrix <- polychoric(data)$rho


The CFA model was specified:


cfa_model <- '

  Factor1 =~ item1 + item2 + item3

  Factor2 =~ item4 + item5

'


fit <- cfa(cfa_model, sample.cov = polychoric_matrix, sample.nobs = n, estimator = "ML")


and the model fit was checked:


summary(fit, fit.measures = TRUE, standardized = TRUE)


Eventually, the CFA model was visualized:


semPaths(fit, what = "std", edge.label.cex = 1.2, layout = "tree", style = "lisrel", rotation = 2)


Sources:

Almeida, D. M., Santos-de-AraΓΊjo, A. D., JΓΊnior, J. M. C. B., Cacere, M., Pontes-Silva, A., Costa, C. P., ... & Bassi-Dibai, D. (2024). The best internal structure of the Diabetes Quality of Life Measure (DQOL) in Brazilian patients. BMC Public Health24(1), 580.

ChatGPT


Saturday, October 26, 2024

Some of the most important sectors in DHA, Islamabad/Rawalpindi, Pakistan

(Source: https://www.dhai-r.com.pk/)

Considering the popular sectors of DHA Islamabad/Rawalpindi, Sector A, Sector B, Sector C, and Sector K, are among the most popular sectors. People living in these areas can have access to basic facilities, including banking, saloons, parks, schools, etc. Sector K is also near Golf Course. Considering the prices of most of the plots in Sectors A, B, and C, prices may range from 2.5 crores to 4.5 crores. Plots near main boulevard could be somewhat higher, such as near 3.25 crores. On the other hand, plots away from main boulevard and plots in low-lying areas can also be obtained at lower prices. On the other hand, plots in Sector K can be in the range from 3.5 crores to 4.5 crores.

Source:

Property Gupshup - πŸ’₯MOST WANTED sectors in DHA Islamabad Rawalpindi | Property Gupshup - https://www.youtube.com/watch?v=tFVtnk-XpWM


Day 11: A challenge to learn basics of Structural Equation Modeling (SEM) using lavaan and semPlot packages in R


 During the next 12 days, I will learn and repeat the basics of structural equation modeling (SEM) using lavaan and semPlot packages in R.

You can search my lavaan posts by typing: #UsmanZafarParacha_lavaan , and semPlot posts by typing: #UsmanZafarParacha_semPlot

=============

During this day, I loaded lavaan and semPlot, and defined the SEM model, as follows:

# Load the packages

library(lavaan)

library(semPlot)


# Define the SEM model

model <- '

  # Direct effect

  productivity ~ management + job_satisfaction + workplace


  # Indirect effect

  job_satisfaction ~ management

'


Then, a supposed data was developed, as follows:

# Simulate a dataset with the relevant variables

set.seed(123)  # For reproducibility


n <- 200  # Number of observations


# Simulate random variables for the model

management <- rnorm(n, mean = 5, sd = 2)  # Management style

job_satisfaction <- 0.5 * management + rnorm(n, mean = 0, sd = 1)  # Job satisfaction

workplace <- rnorm(n, mean = 4, sd = 1.5)  # Workplace environment

productivity <- 0.3 * management + 0.4 * job_satisfaction + 0.5 * workplace + rnorm(n, mean = 0, sd = 1)  # Productivity


# Combine into a data frame

data <- data.frame(management, job_satisfaction, workplace, productivity)


# Inspect the data

head(data)


Then, lavaan was used to fit the SEM model, as follows:


# Fit the model

fit <- sem(model, data = data)


# Display the summary of the SEM results

summary(fit, fit.measures = TRUE, standardized = TRUE, rsquare = TRUE)


Eventually, the model is visualized using the semPlot package, as follows:

# Visualize the SEM model

semPaths(fit, what = "std", layout = "tree", edge.label.cex = 1.2,

         style = "ram", nCharNodes = 0, curvePivot = TRUE)


Source:

ChatGPT


Friday, October 25, 2024

Margalla Orchards by DHA in Islamabad, Pakistan


(Source: Zameen.com)

Margalla Orchards by DHA was launched in 2015. Presently, its transfer is taking place in the office of Federal Government Employee Housing Society, but soon its transfer will start taking place in the DHA, Phase 5 office, which is the main office of DHA. It is near Park Road. Before August, the prices of 1 kanal plots (files) in this area were in the range of 80 lacs to 1 crores. Now, after being linked to DHA, the prices are in the range of 1.6 crore or near or above this, such as above 2 crores. Investment in any area in this place can be of good value. It is about 8500 kanals’ area. Immediately, in its neighbor is Park Enclave, where market rates are above 5 crores at a distance and 6 crores in the start. Comsats University is located in its front. It has different sectors, including A, B, C, etc. Within 3 years, the prices of plots in these sectors can be doubled.

Source:

Real Ustad - 𝐌𝐚𝐫𝐠𝐚π₯π₯𝐚 𝐎𝐫𝐜𝐑𝐚𝐫𝐝𝐬 𝐛𝐲 𝐃𝐇𝐀 𝐈𝐬π₯πšπ¦πšπ›πšπ - π„π―πžπ«π² 𝐅𝐒π₯𝐞 𝐒𝐬 𝐈𝐦𝐩𝐨𝐫𝐭𝐚𝐧𝐭 - https://www.youtube.com/watch?v=33zkpgH7Jdc


Day 10: A challenge to learn basics of Structural Equation Modeling (SEM) using lavaan and semPlot packages in R


 During the next 12 days, I will learn and repeat the basics of structural equation modeling (SEM) using lavaan and semPlot packages in R.

You can search my lavaan posts by typing: #UsmanZafarParacha_lavaan , and semPlot posts by typing: #UsmanZafarParacha_semPlot

=============

During this day, I loaded the essential libraries, and defined the SEM model using the following lines of codes:


# Load libraries

library(lavaan)

library(semPlot)


# Define the SEM model

model <- '

  # Direct effect of teacher experience on instructional methods

  InstructionalMethods ~ a * TeacherExperience


  # Direct effect of instructional methods on student performance

  StudentPerformance ~ b * InstructionalMethods


  # Direct effect of teacher experience on student performance

  StudentPerformance ~ c * TeacherExperience


  # Moderation: Classroom environment moderates the effect of instructional methods on student performance

  StudentPerformance ~ d * Interaction


  # Define indirect (mediation) effect

  indirect := a * b


  # Define total effect (direct + indirect effects)

  total := c + (a * b)

'


Then, a supposed data is generated using the following lines of codes:


# Generate sample data (if real data is not available)

set.seed(123)

n <- 300

data <- data.frame(

  TeacherExperience = rnorm(n, mean = 10, sd = 5),

  ClassroomEnvironment = rnorm(n, mean = 3, sd = 1),

  InstructionalMethods = rnorm(n, mean = 0, sd = 1),

  StudentPerformance = rnorm(n, mean = 75, sd = 10)

)


Then a relationship is created and interaction terms are established, as follows:


# Create relationships and interaction term

data$InstructionalMethods <- 0.5 * data$TeacherExperience + rnorm(n)

data$StudentPerformance <- 0.3 * data$TeacherExperience +

                           0.6 * data$InstructionalMethods +

                           0.4 * data$InstructionalMethods * data$ClassroomEnvironment +

                           rnorm(n)

data$Interaction <- data$InstructionalMethods * data$ClassroomEnvironment


Then we fit the model and visualized the SEM model using the following lines of codes:


# Fit the model

fit <- sem(model, data = data)

summary(fit, standardized = TRUE, fit.measures = TRUE)


# Visualize the SEM model

semPaths(fit,

         whatLabels = "std",

         layout = "tree",

         edge.color = "blue",

         sizeMan = 6,

         sizeLat = 8,

         fade = FALSE)


Source:

ChatGPT


Thursday, October 24, 2024

Six important factors that can lead to increase in property rates and real estate business


The real estate market in Pakistan is going to go up during the next 4 to 6 months. The current account deficits in Pakistan would decrease that can help in improving the real estate market. This decrease can be linked to the amount/payment provided by IMF. Moreover, China, Saudi Arabia, and Russia are going to invest in Pakistan that can also help in improving economic stability. So, this foreign investment would help in the next few months.

Another point is that people from foreign countries would send money to Pakistan in the form of remittances that can also positively affect the real estate market. For instance, if we compare August from September, there has been about 29% increase in foreign remittances.

Another interesting thing is that inflation is very much controlled during the past several months. It is not increasing, and this is a positive sign. This helps people in thinking about things other than day to day operations, such as real estate.

It is also important to note that the devaluation of Pakistani Rupees in comparison to Dollar has stopped. Pakistani Rupee is very much stable at one place. This is interesting, as people may stop investing in money trading and may stop investing in other options, such as real estate.

The interest rate is also an interesting and important factor. It is gradually decreasing that can also lead to increased investment in other options. In 2025, it is said that interest rate would come in single digit.

Pakistan’s exports are also increasing that can also result in increased investment in real estate. Exports result in more inflow of dollars, which is beneficial.

Source:

Asaan Home - Nobody Tells You About Pakistan's Real Estate Crisis | Which Projects are Profiting BIG Right Now! -  https://www.youtube.com/watch?v=K6eCIlrayrM